
In the EU, spatial inequality is often conceptualised as regional inequality, and as a consequence it is measured at the level of large EU regions. Such measures show a large variation in income between European countries and also within countries. At the same time, measuring inequality at this large geographical scale hides variation in income at a more local level, such as metropolitan areas, cities, neighbourhoods and even streets. These within-region levels of inequality can be much more pronounced than between-region levels of inequality, and they can be crucial in understanding the socio-economic outcomes of individuals. To get more insight into the exposure of individuals to concentrations of poverty and their experiences of inequality, it is important to measure spatial inequality at multiple geographical scales, using methods that do not depend on predetermined regions. The latter is important because the efficiency of specific policy interventions directed towards spatial inequalities is scale-dependent and hence it should be based on well-defined and meaningful measures of spatial variation in living conditions.
The main objective of Task 5.2 of the RELOCAL project was to demonstrate how standardized tools can be used for the analysis of patterns of spatial inequality, and how such tools can be applied to different types of geographical data in different countries. By using the k-nearest neighbours method we showed patterns of spatial inequality at different spatial scales in a cross national comparison for Finland, Sweden, The Netherlands, England and Scotland, and we showed how these patterns differ by geographical scale. Comparing the patterns of spatial inequality at the lowest spatial scale across Sweden, Finland and the Netherlands, we find the highest level of segregation can be observed in Finland, and the lowest level of segregation can be observed in the Netherlands. A possible explanation for this is the large social housing sector in the Netherlands, with social housing available in a large proportion of neighbourhoods. This indicates that even more affluent people are likely to live in relative close proximity of low income households in social housing.
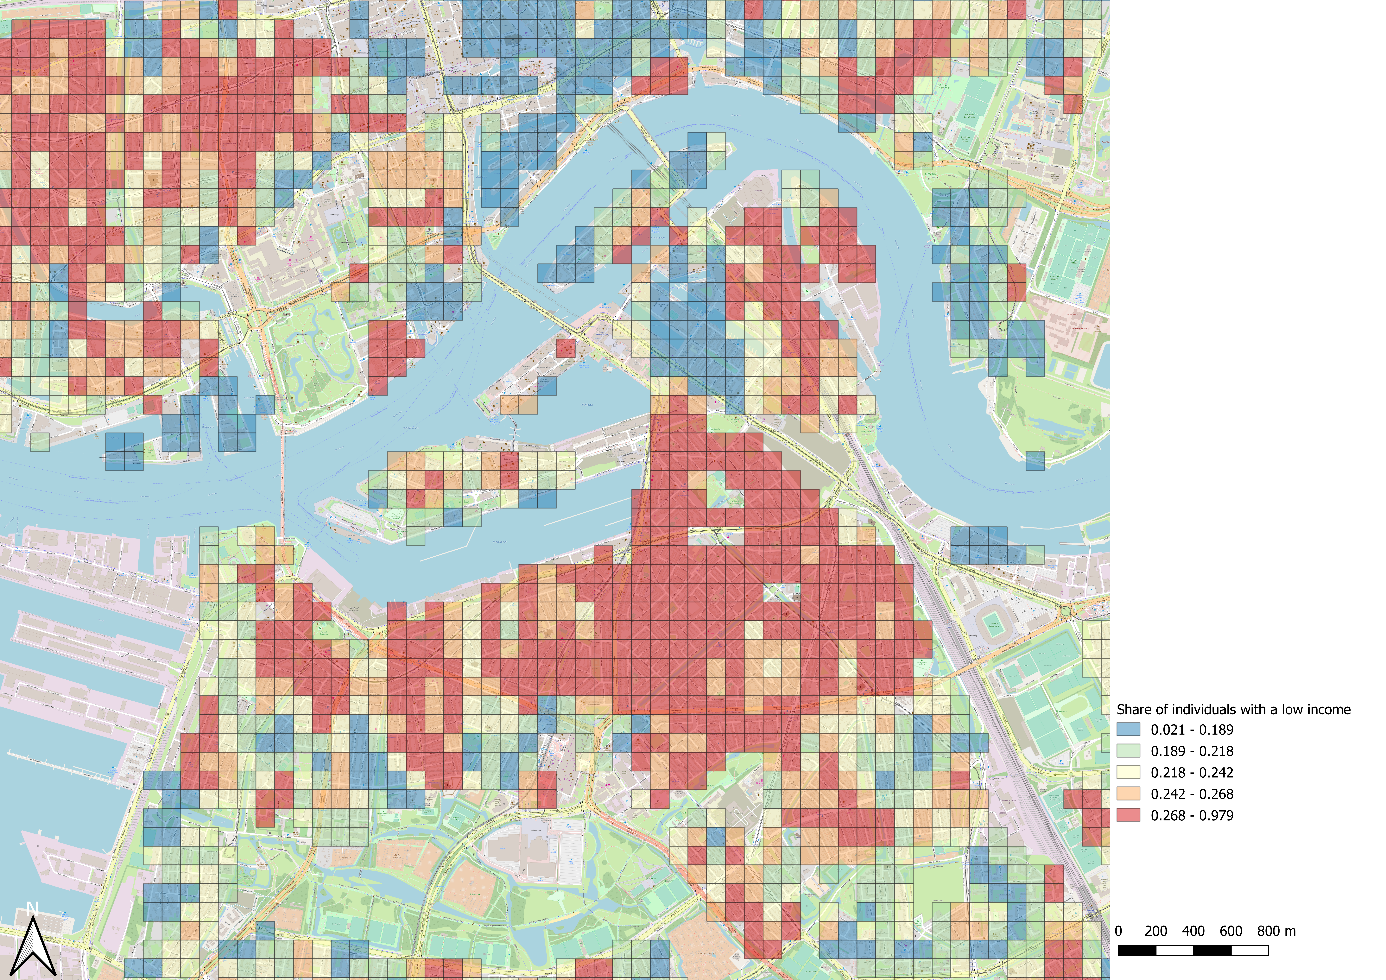
In addition, we mapped patterns of spatial inequality for a selection of case study areas which will be used in Work Package 6 of the RELOCAL project. For each case study area we zoomed in from higher scales to very detailed lower scales. In Figure 1 to 3 the share of individuals with a low income is shown for Rotterdam Zuid, one of the cases study areas that have been selected for the Netherlands. The urban area is characterised by persistent deprivation and has the lowest scores in all of the Netherlands on characteristics such as unemployment, education, crime and general liveability. Looking at the concentration of poverty at a large geographical scale, as plotted in Figure 1, we see that the complete area has high concentrations of poverty. Almost all parts of Rotterdam Zuid fall in the top 20% of areas with the highest concentrations of poverty in the Netherlands. However, if we look at the poverty concentrations at the lowest spatial scale as plotted in Figure 3, we see that within the case study area there is substantial variation in the concentration of poverty. Although the greater part of Rotterdam Zuid still falls in the top 20% of areas with the highest concentration of poverty, there are also parts that are relatively affluent, belonging to 20% areas with the lowest concentrations of poverty. Particularly interesting are these so-called ‘social frontiers’ (Dean, Dong, Piekut, & Pryce, 2018 Frontiers in Residential Segregation: Understanding Neighbourhood Boundaries and Their Impacts. Tijdschrift voor economische en sociale geografie) that emerge: small areas with a high concentration of poverty next to small areas with a low concentration of poverty. With regard to the case studies, these ‘social frontiers’ might be particularly interesting as these are the areas in which individuals most likely experience spatial inequality in their direct residential environments.
Figure 1 Share of individuals with a low income in Rotterdam Zuid for k=51,200

Figure 2 Share of individuals with a low income in Rotterdam Zuid for k=1,600

Figure 3 Share of individuals with a low income in Rotterdam Zuid for k=200
This article is based on Janssen, H. J., & Van Ham, M. (2018). D5.2 Report on multi-scalar patterns of inequalities. H2020 project RELOCAL – Resituating the Local in Cohesion and Territorial Development.
Read complete report D5.2 Report on multi-scalar patterns of inequalities here
